Vistories
Reproducibility, Collaboration, and Communication for Exploratory and Visual Analyses
Reproducibility, Collaboration, and Communication for Exploratory and Visual Analyses
Current visualization tools, however, have a crucial shortcoming: the interactive visual exploration process is not captured, which means that the analysis steps cannot be shared. Being able to reproduce visual analysis sessions and enabling third parties to understand, modify, and extend analysis sessions can have a significant impact on transparency, reproducibility, and innovation of analysis processes. Furthermore, there is enormous potential to utilize visual analysis sessions to efficiently communicate data.
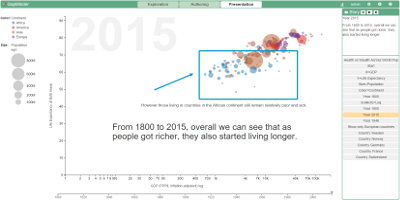
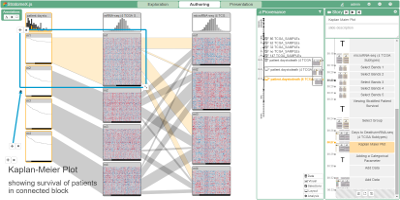
Here we introduce a prototype that is a first step towards making this vision a reality. We capture the visual analysis process and enable users to comment on their decisions to make visual analysis reproducible. We leverage the data about the analysis process to allow scientists to create "Vistories", which are interactive and narrated figures, to communicate their findings. Vistories do not only efficiently communicate the findings, but also give audiences the ability to retrace and modify an analysis. Demos for our prototype for this approach are accessible below.
The source code for our prototype is available on GitHub. Vistories are built with

(in alphabetical order)
Department of Biomedical Informatics at Harvard Medical School
http://gehlenborglab.org | nils_gehlenborg | ngehlenborg
Department of Computer Science at Johannes Kepler University Linz
Viuslization Design Lab, Scientific Computing and Imaging Institute, School of Computing, University of Utah
http://alexander-lex.net | alexander_lex | alexsb
Department of Computer Science at Johannes Kepler University Linz
http://marc-streit.com | marc_streit | marc_streit
We thank Nicola Cosgrove (@NicolaLady) for contributions to the prototype and the video.
Vistories are based on a paper that was published at EuroVis 2016:
Samuel Gratzl, Alexander Lex, Nils Gehlenborg, Nicola Cosgrove, Marc Streit
From Visual Exploration to Storytelling and Back Again
Computer Graphics Forum (EuroVis '16), vol. 35, no. 3, pp. 491-500, doi:10.1111/cgf.12925, 2016.